- Disaster Waste Management Information Site Top page
- Disaster Waste Treatment Archives
- Treatment of Disaster Waste from the Great East Japan Earthquake of March 2011
- Disaster Waste Treatment Progress Management
Disaster Waste Treatment Progress Management
Estimating Volume & Treatment Progress Management
The Ministry of the Environment has received cooperation from disaster-struck local governments to estimate the volume of disaster waste and other waste produced, to regularly determine the progress of treatment, and to generally manage progress. This data has been used as basic data for a variety of policies, such as setting treatment targets in the initial Master Plan and allocating the budgets necessary for financial assistance targeting treatment expenses.
The ministry has continuously collected, examined and organized data from disaster-struck local governments on estimated waste volume and its treatment.
The ministry has categorized the waste as either disaster waste or tsunami deposits. When it is transported to a temporary storage site, the ministry collects data to gain an understanding of the types of waste there (whether it is to be recycled, incinerated, undergo landfill disposal, etc.). Particular emphasis is placed on collecting data from coastal municipalities of the three disaster-struck prefectures in order to manage progress on a monthly basis.
Methods of Estimating Disaster Waste Volume
The initial method used immediately after the Great East Japan Earthquake to estimate the volume of disaster waste was to use satellite imagery to identify which areas had been inundated. Based on this data, the Ministry of the Environment estimated the volume of disaster waste, including houses knocked down by the tsunami (estimated volume in coastal municipalities as of April 2011: around 6 million tons in Iwate Prefecture and around 16 million tons in Miyagi Prefecture).
Treatment Results
(1) Overall Treatment Situation
Treatment of disaster waste and other waste has been performed in 239 municipalities in 13 prefectures. With the exception of parts of Fukushima Prefecture, treatment has been completed in 231 municipalities in 12 prefectures as of the end of March 2014, the stated target. Therefore, treatment has for the most part met its target. Below are figures including the treatment performed thereafter to show the progress made up to the end of March 2015.
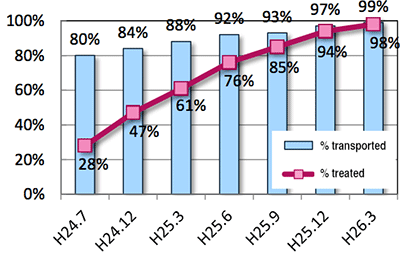
Proportion of Disaster Waste Transported and Treated
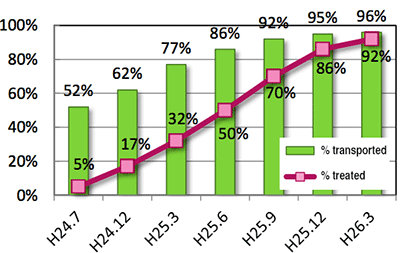
Proportion of Tsunami Disaster Waste Transported and Treated
Disaster Waste and Tsunami Disaster Waste Treated (in 13 prefectures as of March 31, 2015)
| Prefectures | Municipalities | Municipalities completing treatment | Estimated disaster waste of volume (1,000t) | Treated volume (1,000t) | ||||
|---|---|---|---|---|---|---|---|---|
| Recycled | Incinerated | Landfill | Total | |||||
| Disaster waste | 13 | 239 | 237 (99%) |
20,123 | 162,903 [81%] |
2,431 [12%] |
1,332 [7%] |
20,053 (99%) |
| Tsunami disaster waste | 6 | 36 | 35 (99%) |
10,600 | 10,434 [98%] |
- | 166 [2%] |
10,600 (99%) |
Note 1: The percentages shown below the figures for volume treated under "Municipalities completing treatment" indicate progress for the total volume of waste in municipalities with disaster waste, not the number of municipalities.
Note 2: The percentages shown below the figures for the breakdown under "Treated volume" indicate the proportion of total treated volume.
(2) Breakdown by Disaster Waste Category
Based on weight, flammable waste made up around 20% and non-flammable waste made up around 80%. Scrap concrete accounted for over half the total.
Breakdown of Disaster Waste by Category in 13 Prefectures (Unit: 1,000 t) (as of March 31, 2015)
| Flammable waste | Non-flammable waste | |||
|---|---|---|---|---|
| 3,980 (20%) |
16,043 (80%) |
|||
| Flammable items | Scrap wood | Non-flammable items | Scrap metal | Scrap concrete |
| 2,624 (13%) |
1,356 (7%) |
4,906 (25%) |
657 (3%) |
10,480 (52%) |
(3) Breakdown by Disaster Waste Treatment
Around 16 million tons, or over 80% of the disaster waste, was recycled. Of that, 1.1 million tons was used as raw material for cement.
Around 60% of flammable waste was incinerated (around 12% of total disaster waste).
The thorough recycling effort kept the proportion of landfill disposal to under 30% of non-flammable items (or 7% of total disaster waste).
Breakdown of Disaster Waste by Treatment in 13 Prefectures (Unit: 1,000t) (as of March 31, 2015)
| Recycled | Incineration (excluding heat recovery) |
Landfill disposal | ||
|---|---|---|---|---|
| Raw cement material | Heat recovery | |||
| 16,290 (81%) |
1,107 (6%) |
198 (1%) |
2,431 (12%) |
1,332 (7%) |
(4) Treatment Status in Three Disaster-Struck Prefectures
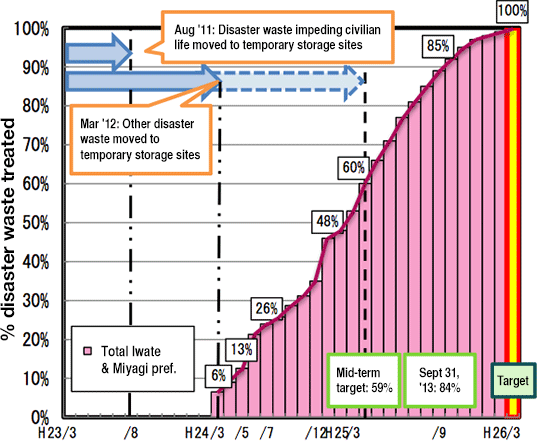
Among the 32 coastal municipalities in the three disaster-struck prefectures, the waste was treated in all the municipalities in Iwate and Miyagi prefectures by the target date of March 31, 2014.
At the peak there was a maximum of 318 temporary storage sites in August 2011, which was the target for transporting disaster waste out of inhabited areas, but that number fell to 22 sites in Fukushima Prefecture.
Targets & Achievement for Treatment of Disaster Waste
in Coastal Municipalities in Iwate and Miyagi Prefectures
(5) Cost of Treatment
The approximately 31 million tons of disaster waste (including around 11 million tons of tsunami disaster waste) from the Great East Japan Earthquake was treated at a cost of approximately 1.15 trillion yen, or around 37,000 yen per ton (including the cost of demolishing collapsed houses).
This cost was slightly higher than in previous disasters. Unlike other disasters, it is believed that a major factor was that the tsunami damage produced waste that was mixed with tsunami disaster waste containing salt, but another view is that not making the treatment the responsibility of local governments impeded cost-saving efforts.
| Disaster | Treatment cost (10k yen/ton) |
|---|---|
| Great Hanshin-Awaji Earthquake | ~2.2 |
| Niigata Prefecture Chuetsu Earthquake | ~3.3 |
| Iwate-Miyagi Nairiku Earthquake | ~1.5 |
| Great East Japan Earthquake | ~3.7 |
Progress on treatment of disaster waste from the Great East Japan Earthquake (archives)
- Progress on treatment of disaster waste from the Great East Japan Earthquake (in coastal municipalities of the three most affected prefectures)(14.3.26up) (PDF 285KB)
- Progress on treatment of disaster waste from the Great East Japan Earthquake (in coastal municipalities of the three most affected prefectures)(14.2.21up) (PDF 284KB)
- Progress on treatment of disaster waste from the Great East Japan Earthquake (in coastal municipalities of the three most affected prefectures)(14.1.24up) (PDF 451KB)
- Progress on treatment of disaster waste from the Great East Japan Earthquake (in coastal municipalities of the three most affected prefectures)(13.12.20up) (PDF 272KB)
- Progress on treatment of disaster waste from the Great East Japan Earthquake (in coastal municipalities of the three most affected prefectures)(13.11.29up) (PDF 313KB)
- Progress on treatment of disaster waste from the Great East Japan Earthquake (in coastal municipalities of the three most affected prefectures)(13.10.25up) (PDF 388KB)
- Progress on treatment of disaster waste by the Great East Japan Earthquake (in coastal municipalities of the three most affected prefectures)(13.9.27up) (PDF 349KB)
- Progress on treatment of disaster waste by the Great East Japan Earthquake (in coastal municipalities of the three most affected prefectures)(13.8.30up) (PDF 342KB)
- Progress on treatment of disaster waste by the Great East Japan Earthquake(in coastal municipalities of the three most affected prefectures)(13.7.26up) (PDF 343KB)
- Progress on treatment of disaster waste by the Great East Japan Earthquake (in coastal municipalities of the three most affected prefectures)(13.6.21up) (PDF 356KB)
- Progress on treatment of disaster waste by the Great East Japan Earthquake(in coastal municipalities of the three most affected prefectures)(13.5.31up) (PDF 337KB)
- Progress on treatment of disaster waste by the Great East Japan Earthquake(in coastal municipalities of the three most affected prefectures)(13.5.7up) (PDF 324KB)
- Progress on treatment of disaster waste by the Great East Japan Earthquake(in coastal municipalities of the three most affected prefectures)(13.3.22up) (PDF 326KB)
- Progress on treatment of disaster waste by the Great East Japan Earthquake (in coastal municipalities of the three most affected prefectures) (13.2.22up) (PDF 184KB)
- Treatment of disaster waste in coastal municipalities of the three most affected prefectures by the Great East Japan Earthquake (13.1.25up) (PDF 617KB)
- Progress on treatment of disaster waste in coastal municipalities from the three most affected prefectures by the Great East Japan Earthquake (12.12.14up) (PDF 252KB)
- Progress on treatment of disaster waste in coastal municipalities from the three most affected prefectures by the Great East Japan Earthquake (12.11.16up) (PDF 244KB)
Guidelines
![]()